Short answer
A greenhouse gas assessment for aquaculture inventories an operation's emissions using the GHG Protocol: Scope 1 (fuel burned on site and in vessels), Scope 2 (purchased electricity) and Scope 3 (feed, smolts, transport and other inputs). ASC-certified farms must record energy use and account for on-farm and feed emissions, and buyers increasingly want the same numbers per tonne produced.
A buyer in Europe has sent a questionnaire asking for your carbon footprint per kilogram of product. Your certification auditor wants to see energy records and a GHG calculation. Your bank’s sustainability-linked loan has a reporting clause. Three different requests, and underneath them all is the same piece of work: a greenhouse gas inventory of your operation that someone else can check.
This article explains what that inventory involves for aquaculture and seafood businesses in Atlantic Canada, what the Aquaculture Stewardship Council (ASC) actually requires, and how to build an assessment that will satisfy an auditor without taking over your year.
What are Scope 1, 2 and 3 emissions?
The GHG Protocol Corporate Standard is the accounting framework behind nearly every certification scheme, buyer questionnaire and disclosure rule. It sorts emissions into three scopes:
| Scope | Definition | Aquaculture examples |
|---|---|---|
| Scope 1 | Direct emissions from sources you own or control | Diesel in workboats and well boats, gasoline in trucks, propane or oil in hatchery boilers, generator fuel at sea sites, refrigerant leaks |
| Scope 2 | Indirect emissions from purchased electricity, heat or steam | Grid power for hatchery pumps and heating, feed barge shore power, processing plant electricity |
| Scope 3 | All other indirect emissions in the value chain | Feed production and delivery, smolts or seed from a third-party hatchery, packaging, outbound transport, waste, employee travel |
Scope 1 and 2 are the numbers you control directly. Scope 3 is where most of a finfish farm’s footprint lives, because feed production (the fishmeal, fish oil, soy, wheat and the energy to process and ship them) carries a large footprint before a single pellet reaches the cage. Shellfish operations, which do not feed, have a very different profile, with fuel and electricity dominating.
Emissions are reported in tonnes of carbon dioxide equivalent (CO2e), which converts methane, nitrous oxide and refrigerants to a common unit. For comparison between farms and years, totals are divided by production to give an intensity: kilograms of CO2e per tonne of live weight, or per kilogram of edible product.
What does ASC require?
ASC’s Salmon Standard (version 1.4 at the time of writing) addresses energy and emissions under its principle on responsible use of resources. In plain terms, certified farms must measure and document their energy use, track greenhouse gas emissions and account for the emissions associated with their feed. Smolt producers supplying certified farms are expected to carry out an energy-use assessment and track their emissions. Feed mills supplying certified farms have their own obligations under the ASC Feed Standard.
ASC is consolidating its species standards into a single Farm Standard. The energy and GHG criteria in that standard move from “record and report” towards intensity metrics (energy per tonne produced, CO2e per kilogram of edible product), reduction targets and a GHG management plan, with annual reporting to ASC. The specific thresholds and transition dates have been through public consultation and should be confirmed on ASC’s programme site before you plan an audit, because they are the part most likely to have changed since this was written.
The practical point: the days when an energy spreadsheet satisfied the auditor are ending.
How do you build an aquaculture GHG inventory?
The process is the same whether the driver is ASC, a buyer or a lender.
Step 1: set the boundary
Decide which facilities and activities are in. For a vertically integrated producer that might be feed mills, hatcheries, sea sites, well boats, processing and head office. For a single-site grower it might be one lease and a wharf. Decide the consolidation approach (operational control is the usual choice) and the reporting year.
Step 2: collect activity data
This is the bulk of the work. Fuel invoices by type and site. Utility bills. Feed tonnage by supplier. Smolt or seed counts and origin. Refrigerant service records. Transport logs for product leaving the gate. Production in live weight and harvested weight. Gaps are normal on a first pass; document them and estimate transparently.
Step 3: apply emission factors
Each unit of activity is multiplied by a factor that converts it to CO2e. For fuels and provincial electricity grids in Canada, Environment and Climate Change Canada’s National Inventory Report is the reference. Grid factors differ a lot across the region, which is why the same hatchery would have a different Scope 2 footprint in New Brunswick, Nova Scotia or Newfoundland and Labrador. For feed, a supplier-specific footprint is best; a published life cycle value is the fallback, clearly flagged as an assumption.
Step 4: calculate, allocate and check
Sum by scope and by facility. Where a facility produces more than one product, allocate emissions on a stated basis (mass or economic value). Then sanity-check: does feed dominate as expected? Does the fuel figure line up with vessel hours? Unexpected numbers usually mean a unit error, not an unusual farm.
Step 5: report and build the reduction plan
The deliverable is a report with the boundary, method, data sources, assumptions, results by scope and intensity metrics, written so an auditor can trace every number. The second deliverable, the one that actually earns money, is the list of what to do about it: fuel switching at the hatchery, vessel routing and idling, feed conversion ratio improvements, electrification of feed barges where shore power exists, and conversations with the feed supplier about ingredient sourcing.
A checklist for the first assessment
- Reporting year and boundary agreed in writing
- Every site listed with its energy sources
- Fuel, electricity and feed data collected for 12 months
- Production data in the same units the standard asks for
- Emission factors sourced and dated
- Assumptions and gaps documented
- Results by scope, by facility and per tonne of product
- Reduction opportunities ranked by cost and effect
What this looks like in practice
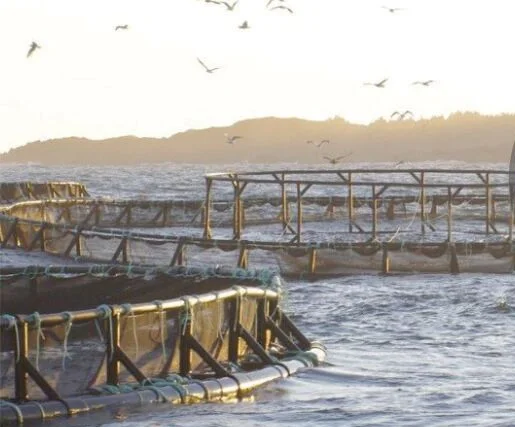
In 2015 our environmental team carried out a greenhouse gas assessment for Cooke Aquaculture’s salmon operations covering seven facilities: two feed mills, four hatcheries and the Liverpool, Nova Scotia sea site. The assessment documented the energy use and greenhouse gas emissions across those facilities in a form that could be reviewed as part of the certification process, and the operation achieved ASC certification in October 2016.
Covering feed mills and hatcheries as well as the sea site is what made the work useful. A sea site on its own has a modest Scope 1 and 2 footprint (boat fuel, barge generators). The feed mills and hatcheries are where the energy-intensive work happens.
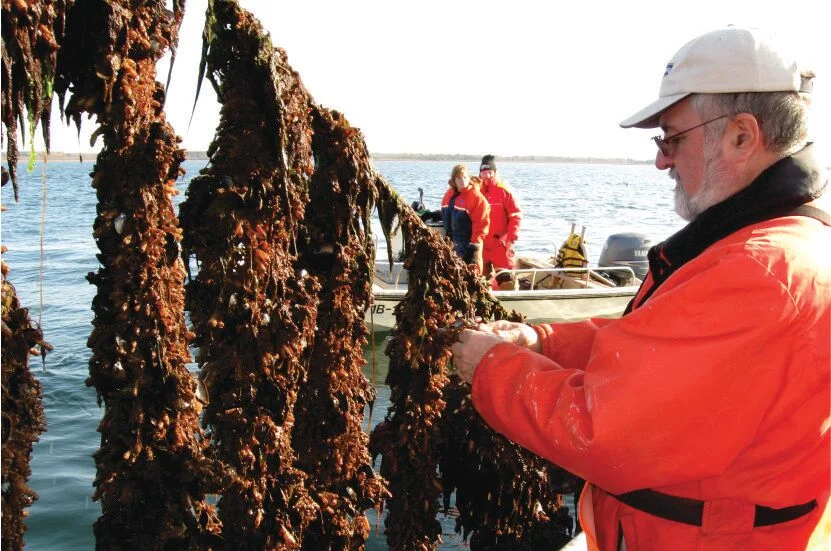
The same site characteristics that drive aquaculture site selection and mooring design (current, depth, distance from shore) drive the vessel fuel burned servicing it. Our earlier work on tunicate control at PEI mussel farms is a reminder that shellfish operations have their own version of this problem, where fouling management drives the fuel and labour that drive the footprint.
What do buyers and lenders ask for beyond certification?
Certification is the floor. Increasingly, the questions come from downstream:
- Retail and food service buyers ask for product carbon footprints and may run their own supplier scorecards that want Scope 1, 2 and 3 broken out.
- Lenders and investors writing sustainability-linked terms want a baseline, an annual update and evidence of progress.
- Regulators and disclosure regimes in export markets are moving towards mandatory Scope 3 reporting for large companies, which pushes the data request down the supply chain to producers.
An inventory built to the GHG Protocol once will answer all three with minor reformatting.
For land-based facilities, the GHG inventory and an energy audit are natural companions: the article on energy audits and fuel conversions covers where the savings usually are, and hatchery boiler plants are no exception. Our environmental team handles the inventory, and our building systems engineers handle the mechanical changes that follow.
The bottom line
A greenhouse gas assessment for an aquaculture business is an accounting exercise with an engineering payoff. Get the boundary right, collect twelve months of real data, use published factors and write it up so an auditor can follow it. ASC, your buyers and your bank will each be satisfied by the same document, and the reduction plan built on it is where the operation actually saves money.
Key takeaways
- Feed is usually the largest single source of emissions in finfish aquaculture, and it sits in Scope 3, outside the farm gate.
- ASC certification requires farms to measure and document energy use and account for emissions from both the farm and its feed.
- A GHG inventory is only as good as the activity data: fuel invoices, utility bills, feed tonnages and transport logs.
- Intensity metrics (kg CO2e per tonne of live weight or edible product) are what buyers compare, not absolute totals.
- The first assessment sets the baseline; the value comes from the reduction plan built on it.
Questions we get asked
What is the difference between Scope 1, Scope 2 and Scope 3 emissions?
Under the GHG Protocol Corporate Standard, Scope 1 covers direct emissions from sources the company owns or controls, such as diesel in boats and generators or propane in a hatchery boiler. Scope 2 covers indirect emissions from purchased electricity, heat or steam. Scope 3 covers all other indirect emissions in the value chain, including purchased feed, smolts, packaging, outbound transport and processing. For a fish farm, Scope 3 is normally the biggest number by a wide margin.
Does ASC certification require a GHG assessment?
The ASC Salmon Standard requires farms to measure and document their energy use, track their greenhouse gas emissions and account for emissions associated with feed, and smolt producers supplying certified farms must carry out an energy-use assessment and track their emissions. ASC's newer Farm Standard, which is replacing the species standards, moves to intensity-based reporting with reduction targets. Check the current version and transition dates on ASC's site, because the requirements have been tightening.
What data do I need to collect for an aquaculture GHG inventory?
For a 12-month period: fuel purchases by type for vessels, vehicles, generators and boilers; electricity and other utility bills for every site; feed delivered by tonne and supplier; smolt or seed numbers and their source; refrigerant top-ups; and outbound transport distances and modes. Production figures in live weight and harvested weight are needed to calculate intensity. Most of this already exists in accounting and farm management systems; the work is in pulling it together consistently.
Which emission factors should be used in Atlantic Canada?
For fuels, Environment and Climate Change Canada publishes national emission factors in its annual National Inventory Report. For electricity, use the provincial grid factor from the same source, which differs sharply between provinces: hydro-heavy grids are low, while grids with more fossil generation are higher. For feed, the best source is a supplier-specific footprint from the feed mill; otherwise a published life cycle figure is used and documented as an assumption.
How often should a GHG assessment be updated?
Annually is the norm, and it is what certification schemes and most buyer reporting programs expect. Once the first inventory is built, updating it is mostly a matter of refreshing the activity data, provided the method and boundaries are documented so the numbers stay comparable year to year.